knows before it overflows
Simple server monitoring for people who have better things to do.
Brimfull watches disk, CPU, and memory on the handful of servers you actually run, and gives you a heads up before they overflow. One shell script in your crontab. No agent, binary, or ports to open.
Simple, Open-Source, and Free!
HEALTHY
web-01 · /dev/sda1
disk usage
flat · calm
You've been here: the site's down, the disk's full, the database wrote nothing for six hours. You've got a script. It works, mostly. You know you should do this properly, but don't want to spend a weekend installing Grafana to watch two servers.
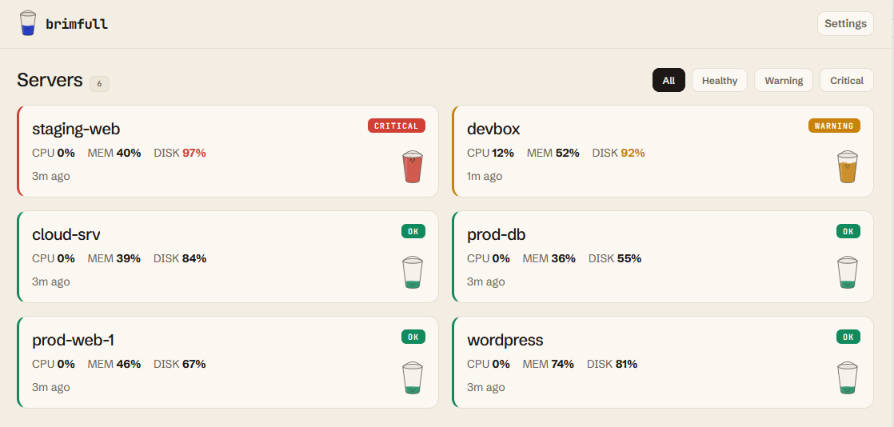
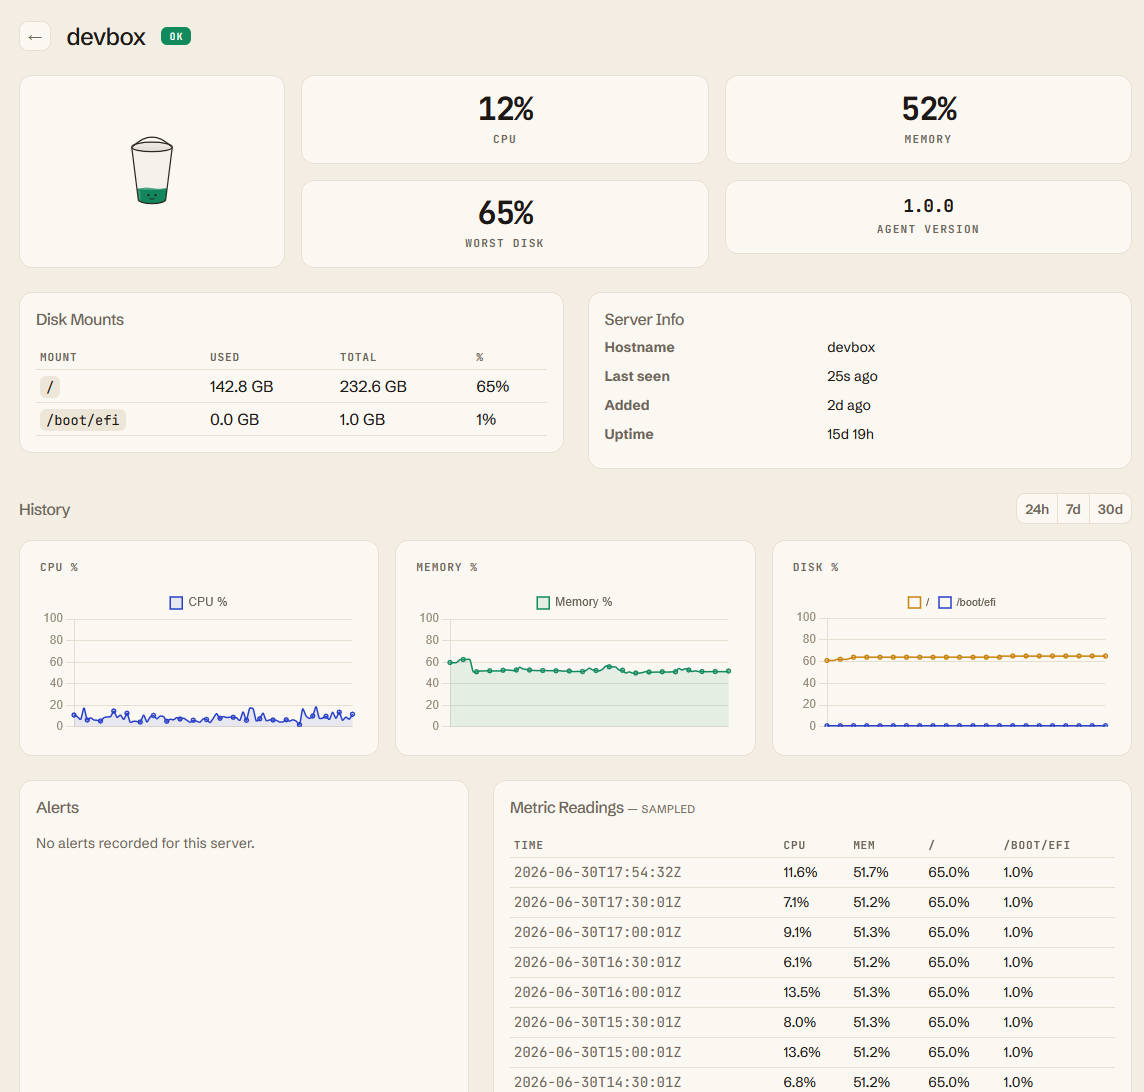
The dashboard
Everything on one screen. Nothing you don't need.
How it works
One shell script. Five minutes. Done.
No agent process. No inbound ports. Works on anything with df and curl.
01
Drop one script into crontab
Paste a single bash script. No package to install, no agent binary, no daemon to babysit.
02
Point it at your Brimfull URL
Your endpoint, your API key. The server pushes out; nothing reaches in. No ports to open, no SSH keys to configure.
03
Get told before things go wrong
Alerts at 75%, not at 100%. Over ntfy, Telegram, or plain email. [More Alert Methods Coming!]
What you get
Just The Basics. No alerts or stats you don't need.
disk · cpu · mem
Per server, per mount point. The three numbers that actually wake you up.
alerts that fire early
Notified before you're in trouble, not after. 75%, not 100%.
runs anywhere
Ubuntu, Debian, AlmaLinux, Amazon Linux, Alpine. If it has df, it works.
nothing to install
No binary. No SSH access. No inbound ports. Just a crontab entry and a key.
self-host in docker
One container, one volume mount, done. Your data stays on your box.
notifications you pick
ntfy, Telegram, or email. Wire up the one you'll actually read.
Why not just use [X]?
It won't replace Grafana. It's not supposed to.
You'll wonder why not just use this [other tool]. Here's why:
This is NOT for you, if you are…
✕
A Linux super-admin
You already have Prometheus, Alertmanager, and a 200-line yaml that tracks node_entropy_available_bits. You don't need this.
✕
Running 50+ servers
At that scale you need a proper observability platform. Datadog will hurt less than you think.
✕
Wanting deep metrics visibility
If you need iowait, steal time, tcp_retransmit_segs, per-process CPU flamegraphs, or custom PromQL queries — this isn't your tool.
This IS for you, if…
✓
You have a handful of servers
A VPS, a home server, a few droplets. Enough to care about, not enough to justify an ops engineer.
✓
You want to focus on shipping, not babysitting
Your time is for building product. Not configuring dashboards, tuning alert thresholds, or staring at graphs.
✓
You want peace of mind & a good night's sleep
Brimfull is watching. If something's about to go wrong, you'll hear about it before your users do.
Set it up before the next 3am.
Brimfull is under active development. Ideas or thoughts? Put em here:
Submit here!